Case Study · MontyCloud
You know what's worse than cloud risk?
Missing one buried inside 57 assessment questions.
AWS paid MSPs $5,000 for every completed Well-Architected Review.
Per customer. Real money. Nearly free, if you could actually complete the workflow.
$5,000
AWS Credits
The platform architects were given
Findings in one view. Questions in another. No connection between them.

Answer 57 questions. Open a separate findings view. Then manually map each one.
Severity, failed resource, remediation guidance, cross-referenced by hand, every session.
So MSPs did what humans always do when software fails them.
They opened spreadsheets.
MontyCloud
Personal sheet
Finding a single high-risk issue took 8–12 minutes of manual scanning.
Every session. Before the actual assessment conversation could even start.
Before I touched Figma, I pushed hard on full automation.
Scan the environment. Prepopulate every answer. Remove the manual work entirely.
One wrong auto-classification. Trust gone.
In cybersecurity, pure automation doesn't survive first contact with real architectural nuance.
Augmentation, not automation.
Surface the right information at the right moment. Keep the expert in the loop.
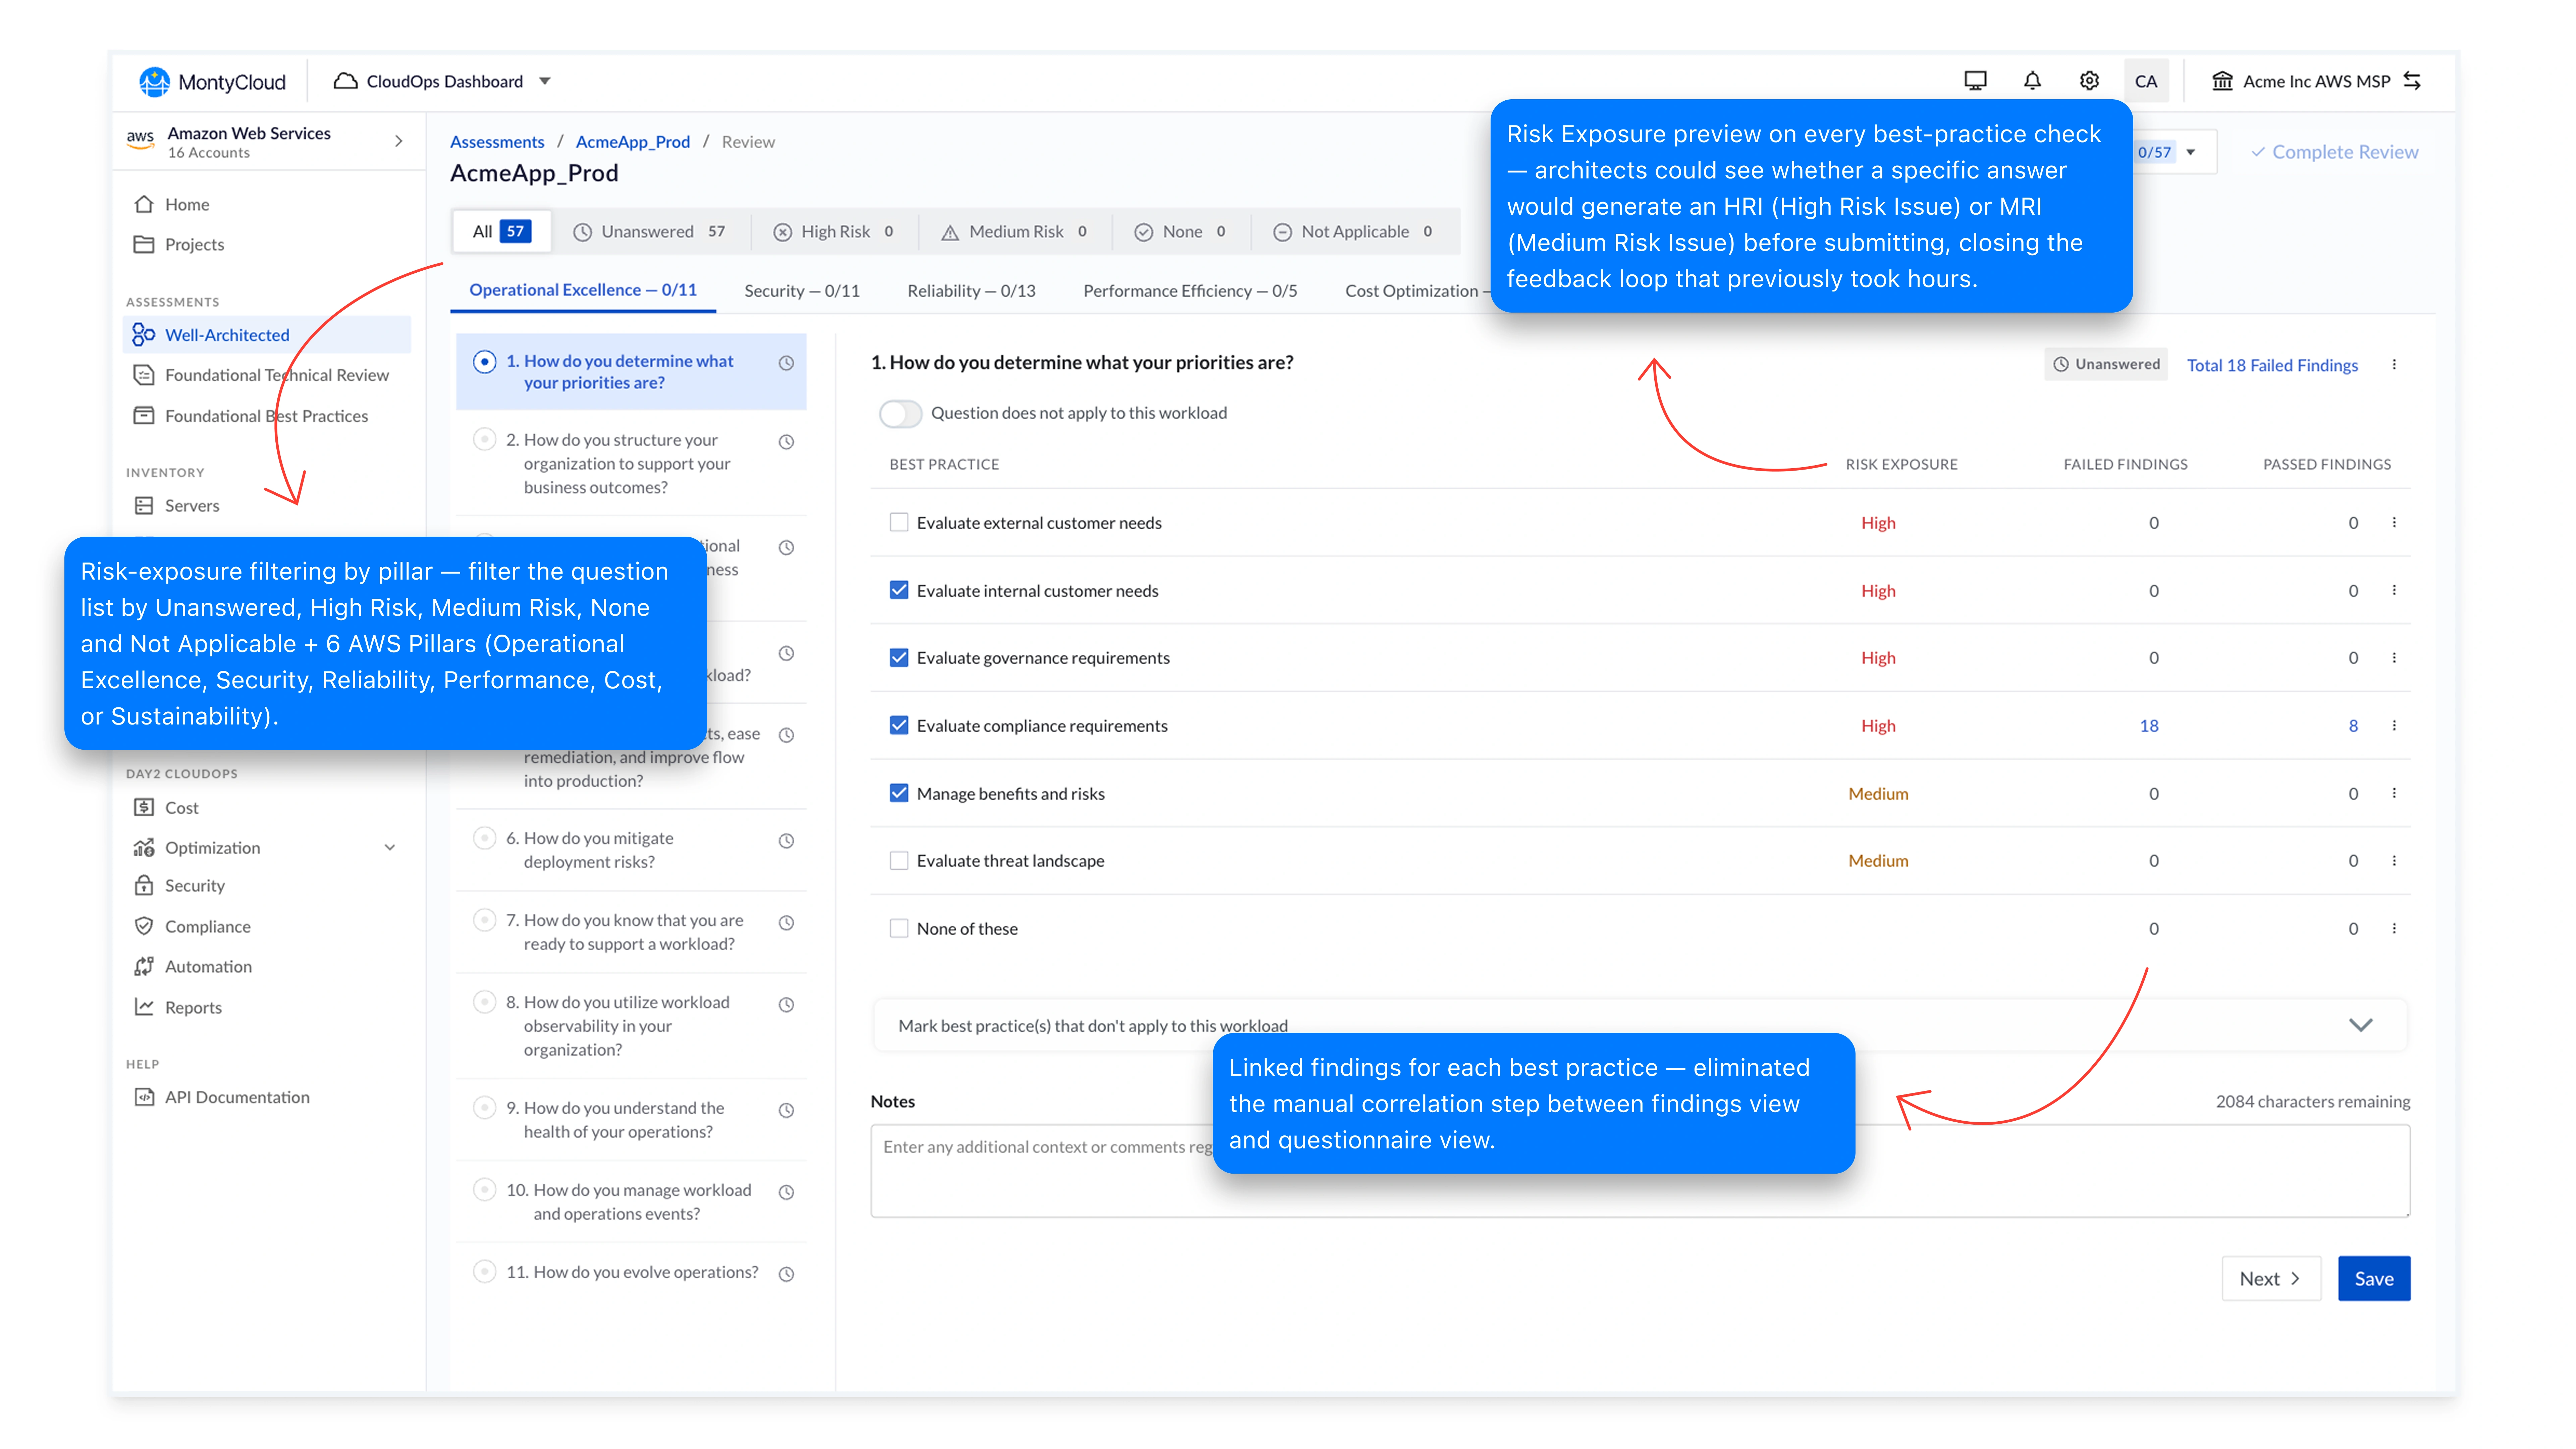
The summary already showed '6 High Risk, 12 Medium Risk.'
But clicking those numbers did nothing. They were dead text.
Summary
So instead of redesigning the entire workflow,
we redesigned finding.
Turn the summary into the filter.
Click '6 High Risk', and only high-risk questions appear. The scanning problem becomes a pointing problem.
One click → only critical issues
Risk filtering · in action
Every decision has a reason.

Every decision has a reason.
Hick's Law
Decision time grows logarithmically with the number of choices, first formalized by William and Edmund Hick in 1952.
The original table showed 57 questions with severity labels scattered throughout. Architects were holding risk counts in working memory while their eyes scanned the list, two cognitive tasks running simultaneously.
By collapsing the interface into 3 clickable risk buckets, we turned a scanning problem into a pointing problem.
Result: 8–12 min → under 1 min to identify high-risk questions.
8–12 min
To find high-risk issues
< 1 min
With clickable filters
Same data. Different interaction.
Status was the next decision.
The PM proposed what every competitor does: red, yellow, green dots.
Status: colour only
Color alone breaks for roughly 1 in 12 men.
Our MSP audience skewed heavily male. A red dot and a green dot look identical to them.
Status: colour only (~8% of users)
Same UI. Different brain. The label is gone.
So we replaced color memory with shape recognition.
So we replaced color memory with shape recognition.
Dual-Coding Theory
Psychologist Allan Paivio (1971) found that encoding information through two channels simultaneously reduces cognitive ambiguity and improves recall under pressure.
Color-only status dots force the brain to decode a single channel. Under pressure, scanning 57 rows, that channel breaks, especially for the roughly 1 in 12 men who can't distinguish red from green.
Shape + color gives the same information through two redundant paths. Either channel alone is enough. Together, they're faster to process and impossible to confuse.
MSPs weren't just answering questions.
They were proving progress to AWS.
Guidance in context. Not in a tab.

Guidance in context. Not in a tab.
Live Coaching Module
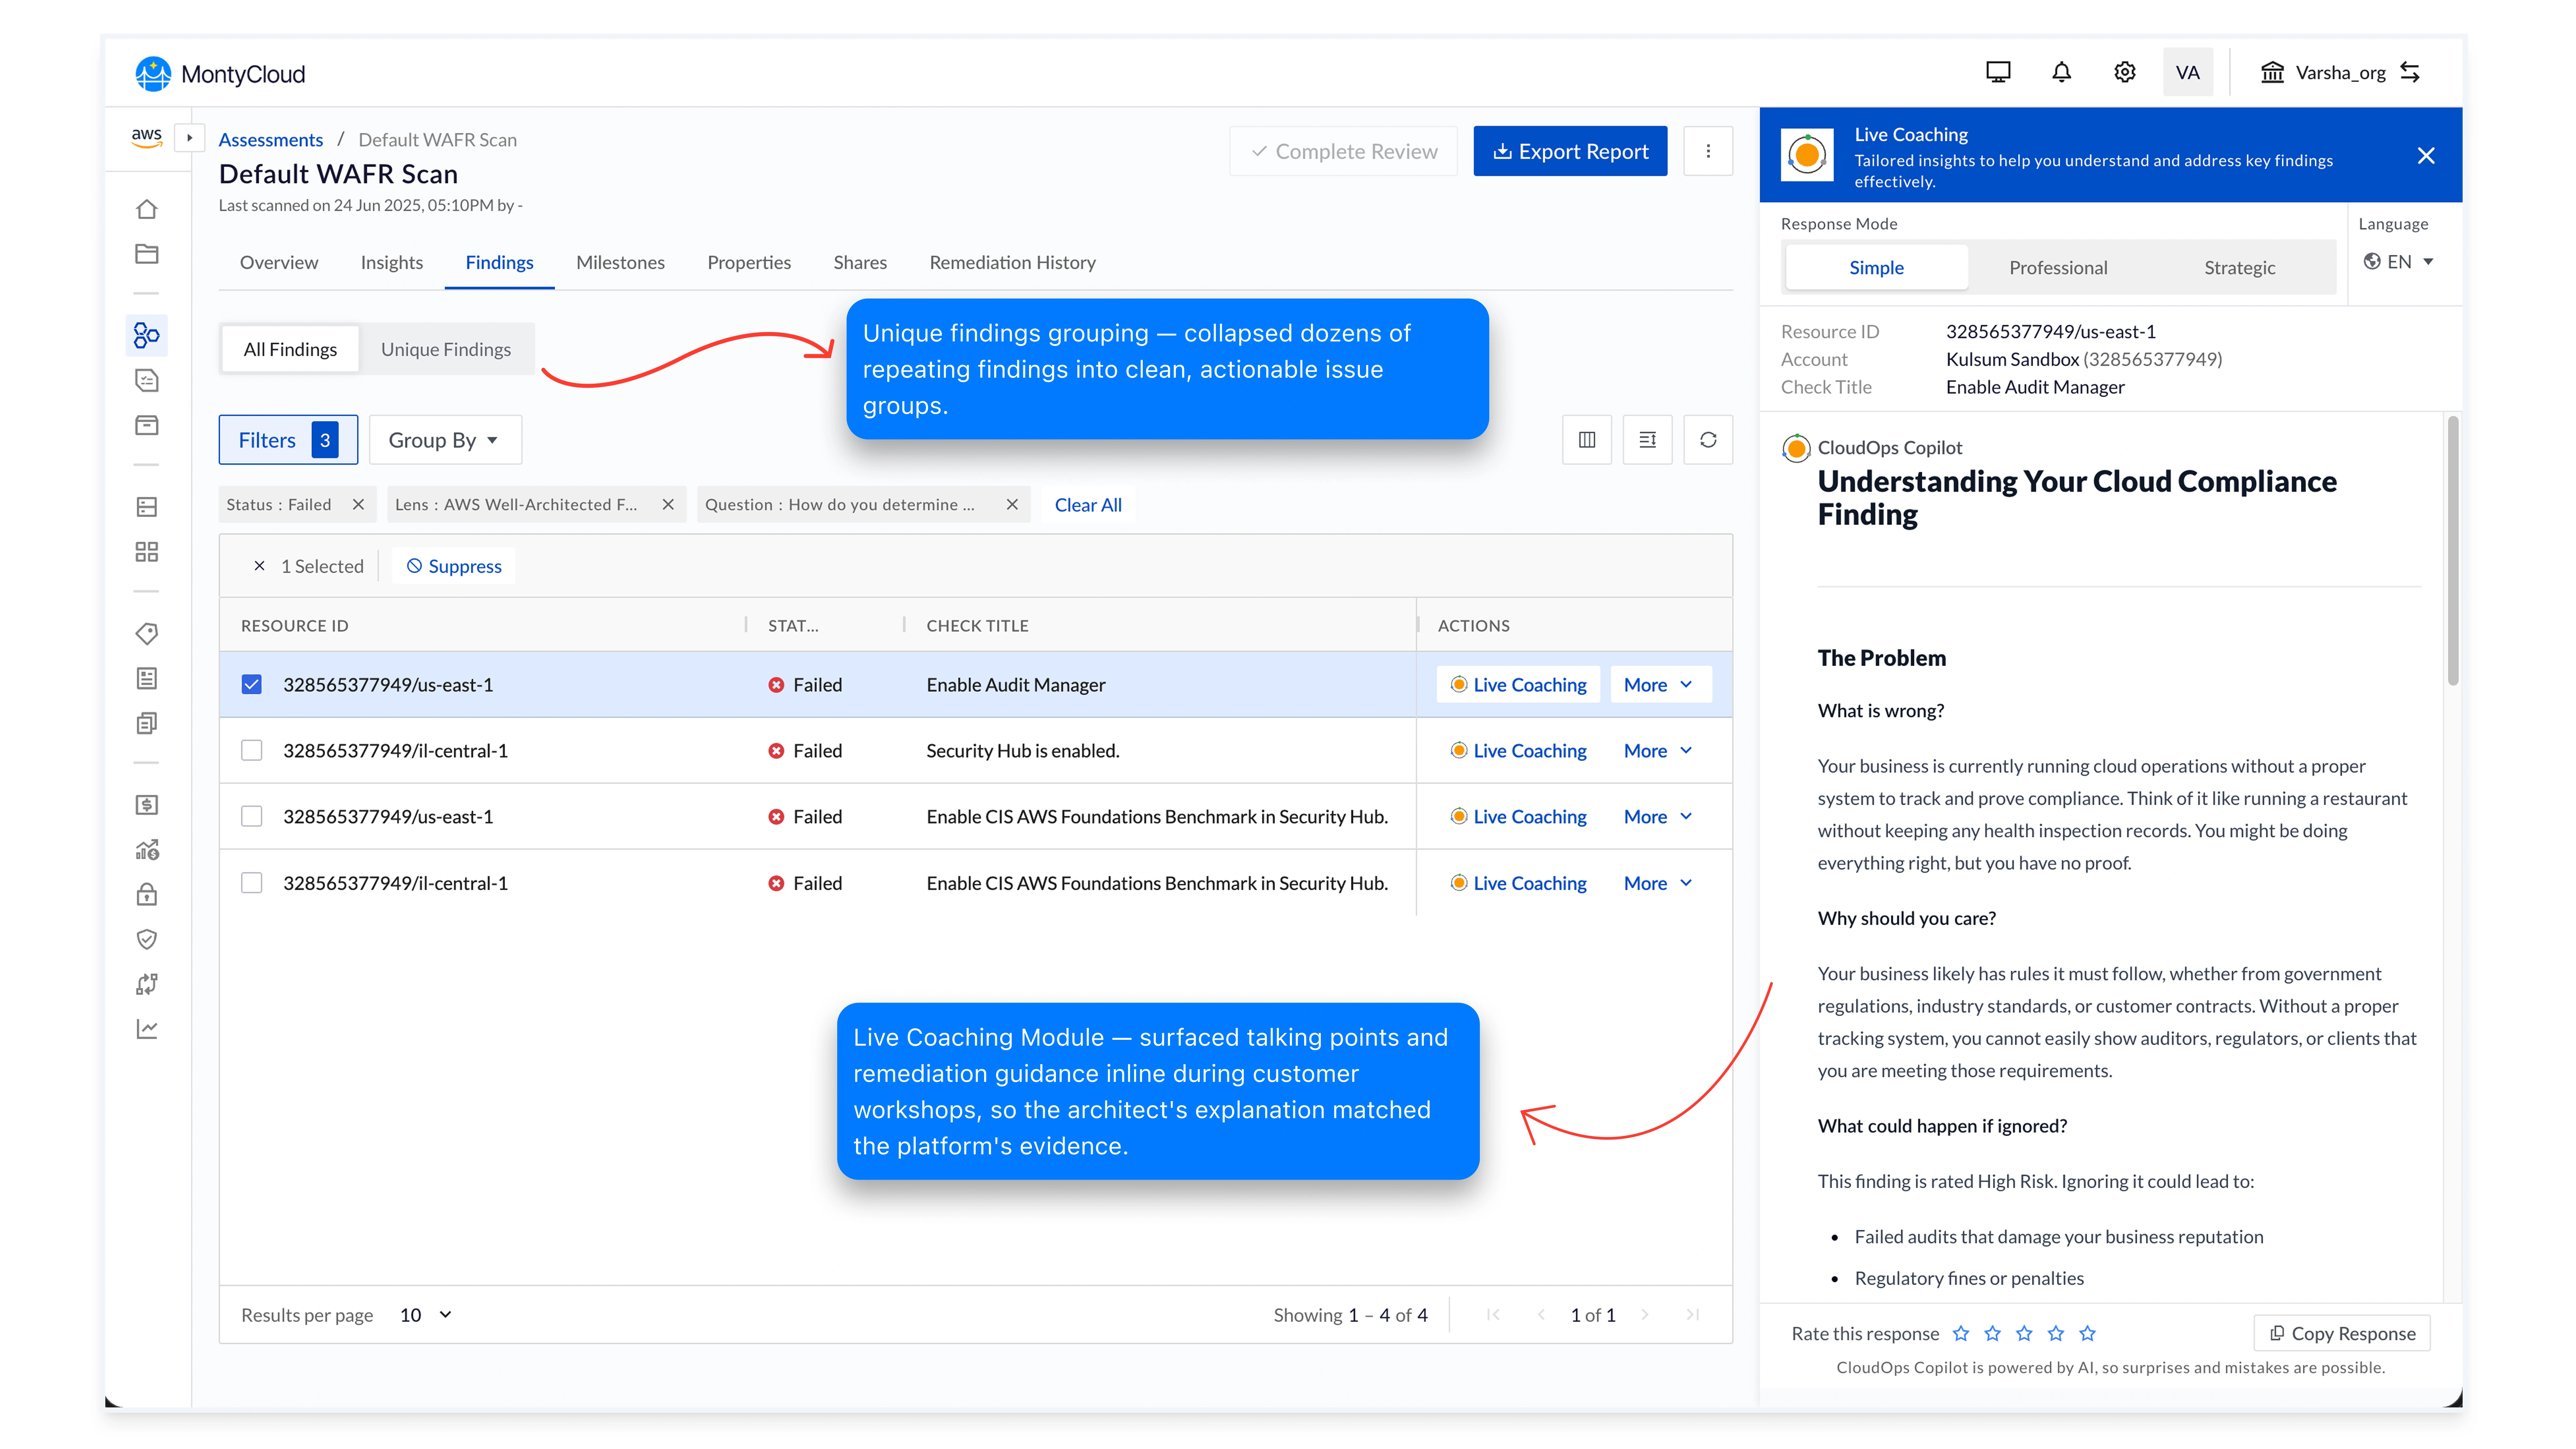
Architects don't open new tabs during live customer workshops. Knowledge one click away might as well be on another planet, under facilitation pressure, they need the right sentence in the right place.
The same logic that put filtering inside the summary counts put guidance inside the row that triggered the question. Contextual coaching panels surface talking points, remediation guidance, and customer-language explanations inline as the architect clicks each finding.
Outcome: Architect explanations matched the platform's evidence, closing the credibility gap that had been the loudest sales-team complaint for two years.
Live Coaching Module · in action
0
MSPs claimed credits · 2 years
16
MSPs claimed credits · 6 months
The interface made the workflow possible for the first time. That's capability impact: not UX impact.
But the real design signal was different.
…34%
Completion rate · before
87%
Completion rate · after
People stopped abandoning the process. That's the design signal: not the credits.
Good enterprise UX isn't about making dashboards prettier.
It's about reducing cognitive effort inside high-stakes workflows.
That's a wrap
What's next?

Vision UI. The Design System That Made Dark Mode, White-labeling, and Consistent Shipping Possible at MontyCloud.
From 5-Hour Reports to 45 Minutes. MontyCloud's First Insights Dashboard, Adopted by 94% of Customers.

Rebranding Konfhub Before a Fundraising Round. New Identity, Tighter Messaging, and a Design System That Helped Them Raise.
Use your keyboard arrows
to continue the story!